

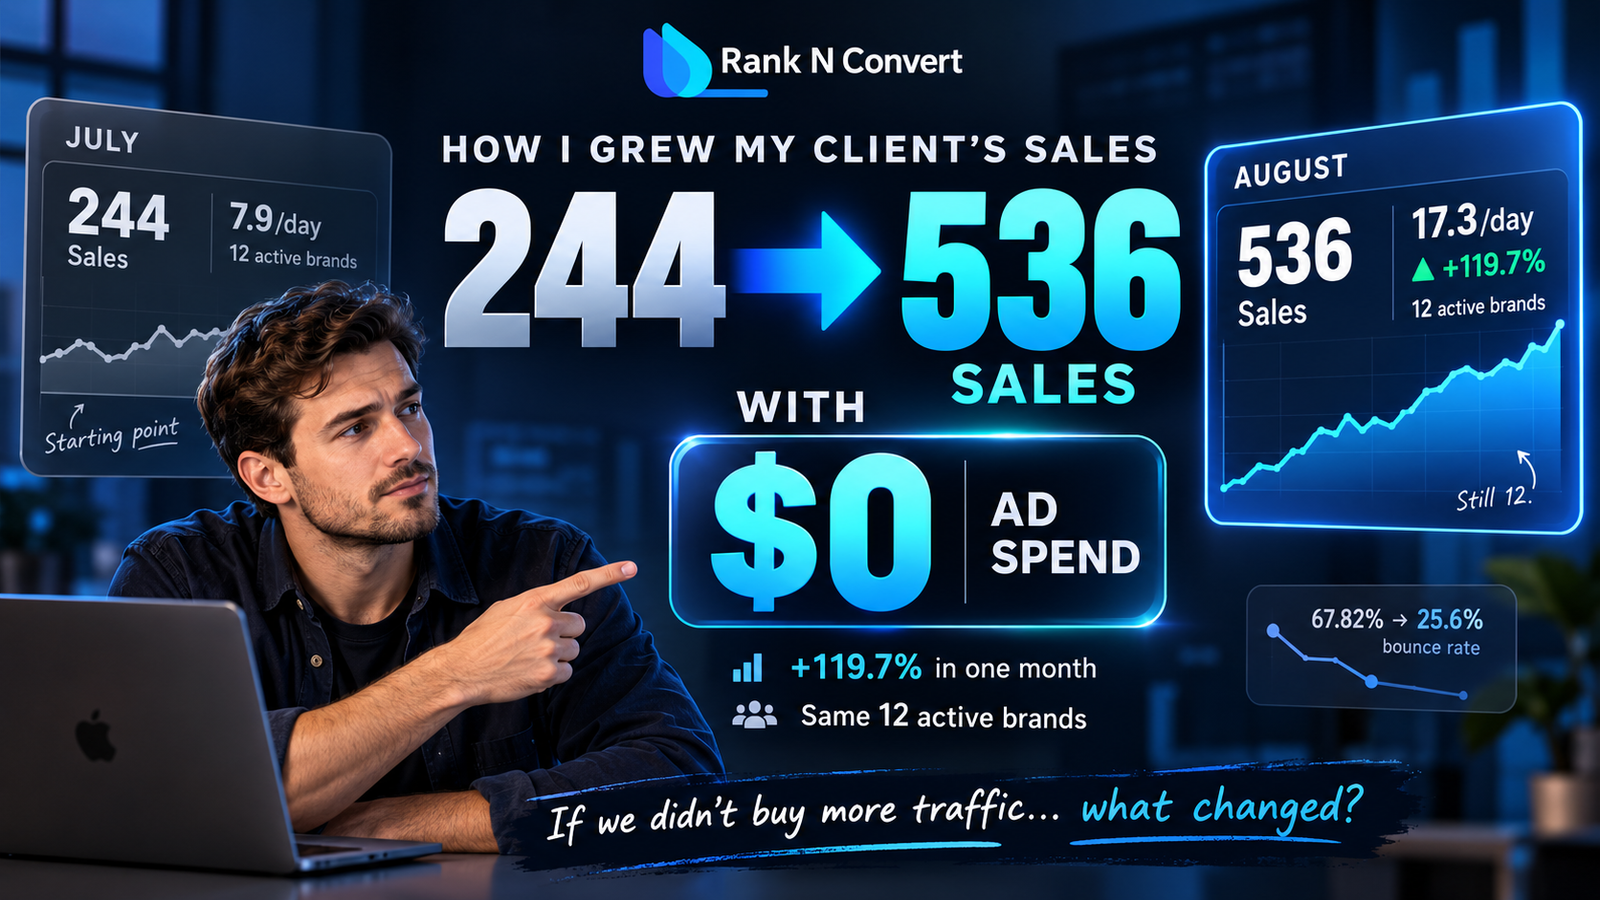
“Can we get to 800+ sales?”
That was the ambition in one of my early conversations with the CEO.
It was a big target, so before giving her an answer, I wanted to understand what we were actually starting with.
My next question was simple:
“How many sales did we do last month?”
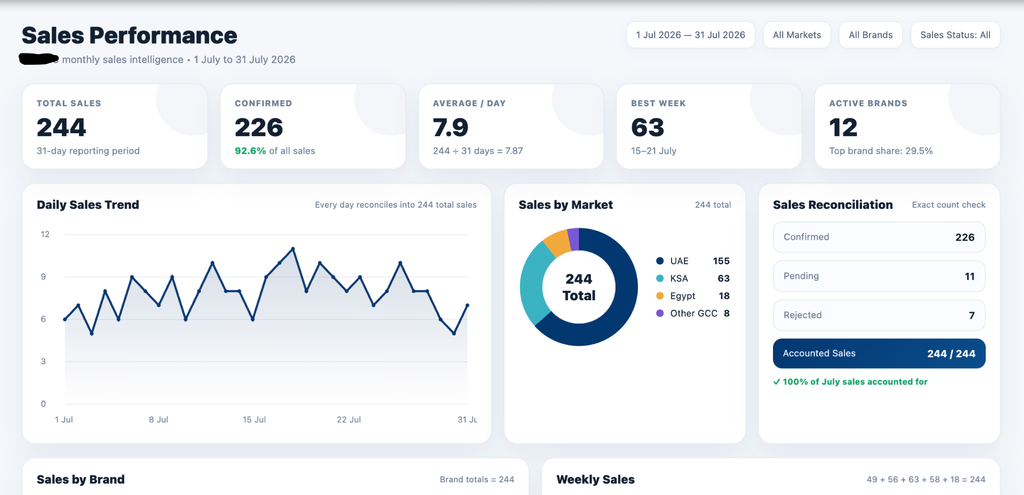
The answer was 244 in July.
That number mattered. Getting from 244 to 800 in a single month would mean more than tripling sales, and I was not going to promise that without first understanding what was holding the store back.
The obvious next thought was acquisition. If we wanted significantly more sales, could we put more money behind Google Ads, performance marketing or stronger link building?
I asked.
The answer was clear: no major additional budget.
That changed the problem completely. I could not simply buy more visibility and hope the extra traffic converted. Whatever growth we created had to come largely from making better use of the demand the business already had.
And when I looked at the site, that started to feel like the bigger opportunity anyway.
- Traffic was arriving.
- Too much of it was being wasted before checkout.
So instead of agreeing to 800+, I pushed back.
Based on July’s 244 sales, the condition of the site and the resources available, I told her that 450 sales in the next full month was the number I was prepared to stand behind.
Before chasing 800, we first had to fix what happened between the click and the checkout.
July became the implementation month.
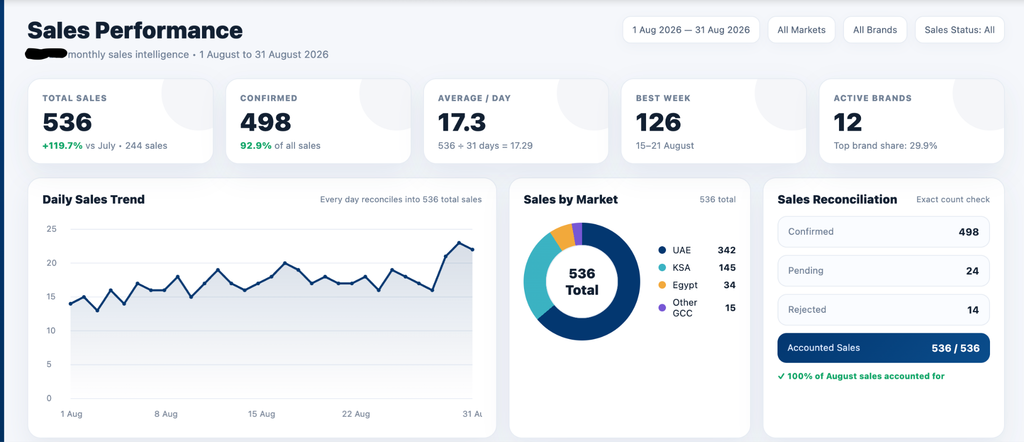
August became the test. And when August closed, the number was not 450.
It was 536.
What changed in one month?
| Metric | July | August |
|---|---|---|
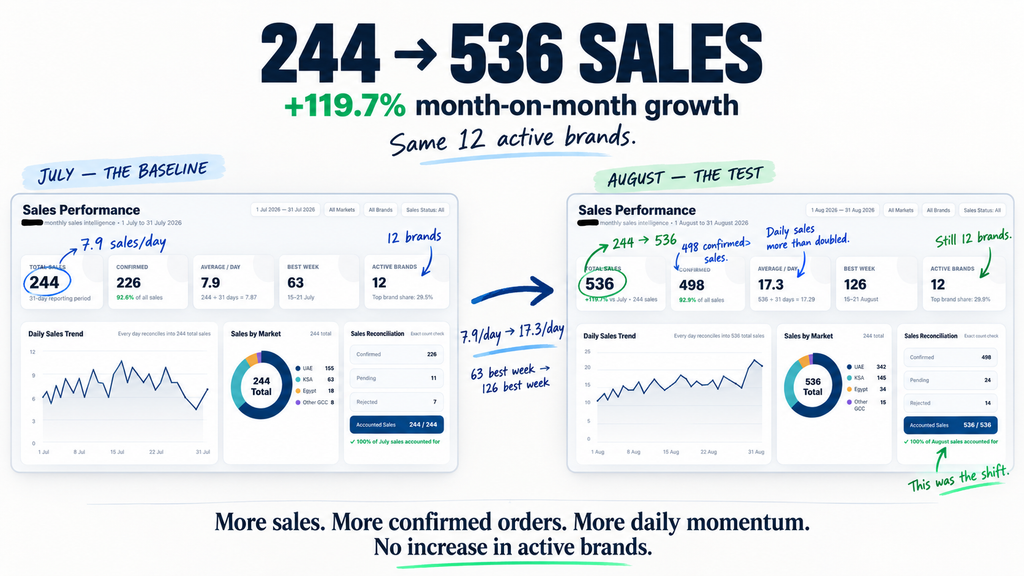
| Total sales | 244 | 536 +119.7% |
| Confirmed sales | 226 | 498 |
| Average sales/day | 7.9 | 17.3 |
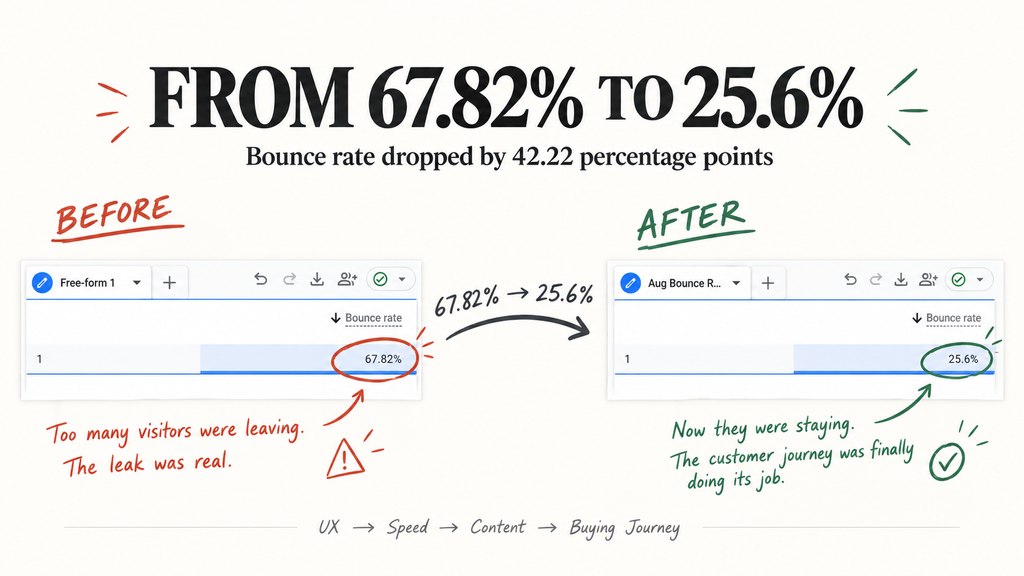
| Bounce rate | 67.82% | 27% Improved |
Here’s the July sales performance overview.
It gave me the baseline: 244 sales and 7.9 sales per day. From here, I could see where the biggest opportunities were and what needed fixing first.
More traffic was the obvious answer. It was not the first answer.
A 67.82% bounce rate made me question what another thousand visitors would actually achieve. A high bounce rate does not tell you the cause. It only tells you where to start looking.
So I stopped staring at the dashboard and started my James Bond-level investigation and walked through the store like a customer.
The product wasn’t the main culprit. The website was.
- Slow pages
- Clumsy mobile experience
- CTAs buried too far down
- Too much scrolling
- Long descriptions that missed simple buying questions
The store was making customers work too hard to buy.
It had a leakage problem.
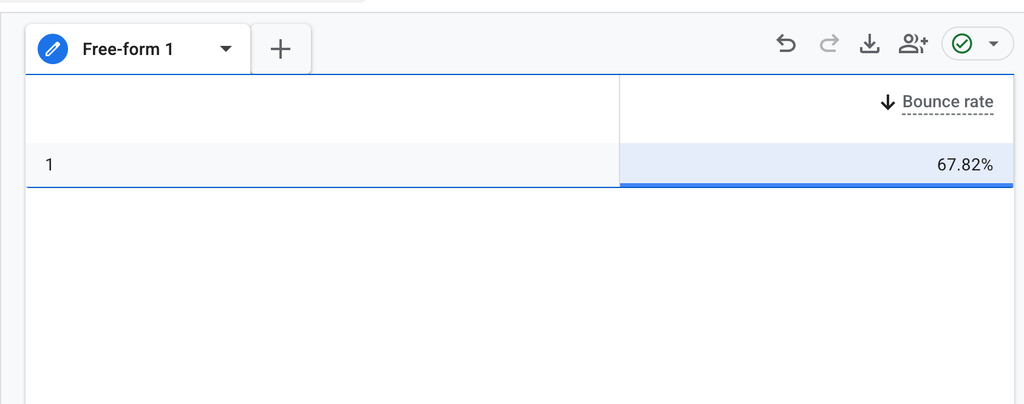
The 67.82% bounce rate gave me the signal. The technical and UX audit showed me where the friction was coming from, from page speed and mobile usability to layout issues and weak conversion paths.
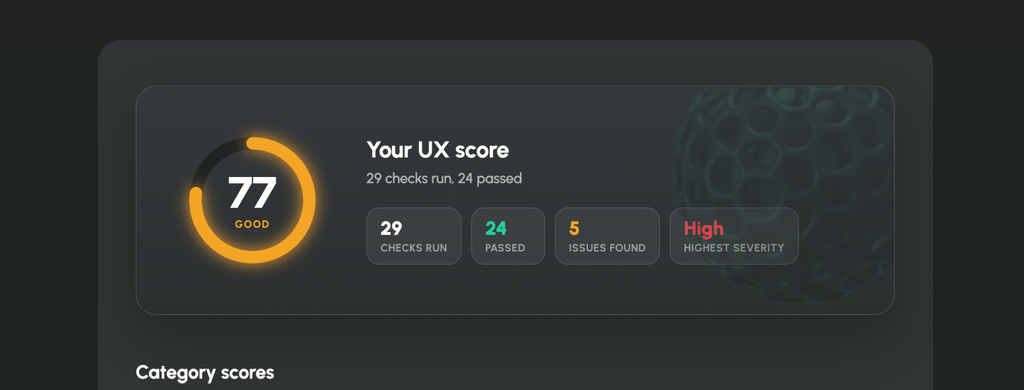
That 77 score gave me a clear list of what needed fixing. I simplified navigation, pulled important actions higher on the page, reduced unnecessary scrolling, tightened layouts, and made key buying information easier to reach.
I also introduced what I called the “2-scroll rule”:
If someone lands on a page, they should find what they came for within two scrolls.
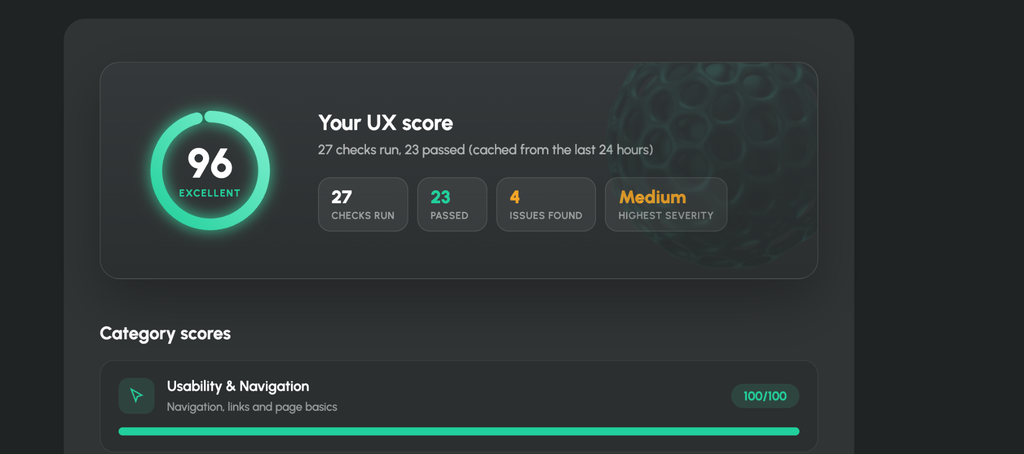
After those changes, the UX score moved from 77 to 96.
And it was not just a front-end problem. The backend performance was struggling too. PageSpeed showed the mobile experience was painfully slow. At one point, the site felt slower than my four-year-old toddler deciding which shoes to wear.
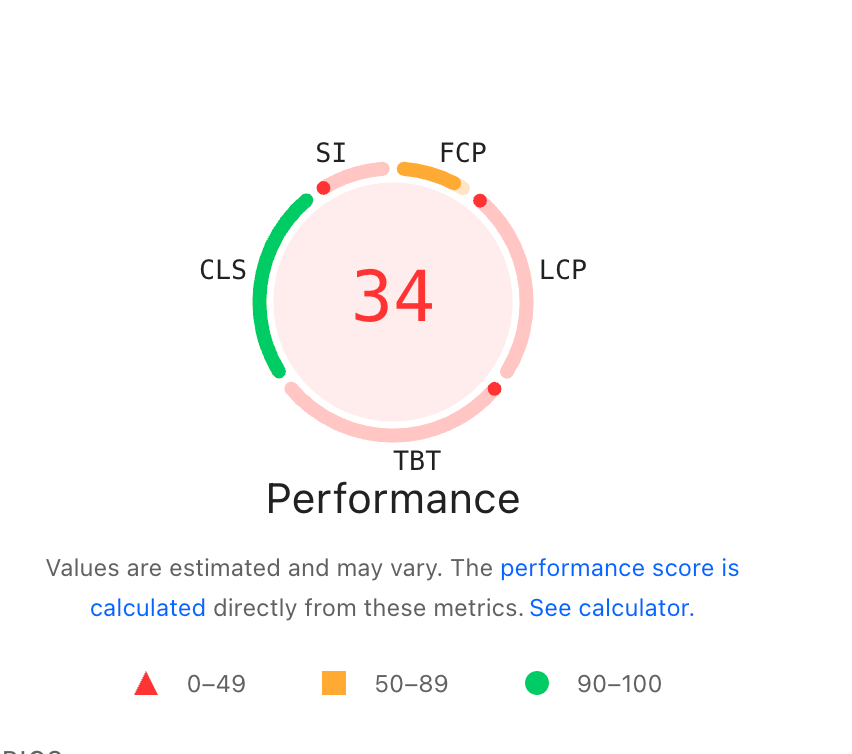
I treated the 34 PageSpeed score as a technical bottleneck, not just a metric.
I focused on the biggest issues:
- Compressed and resized heavy images
- Deferred non-critical JavaScript
- Reduced unused CSS and page bloat
- Improved lazy loading and browser caching
- Prioritized above-the-fold content like product images, price and CTA
The goal was simple: make the page feel faster for a real shopper.
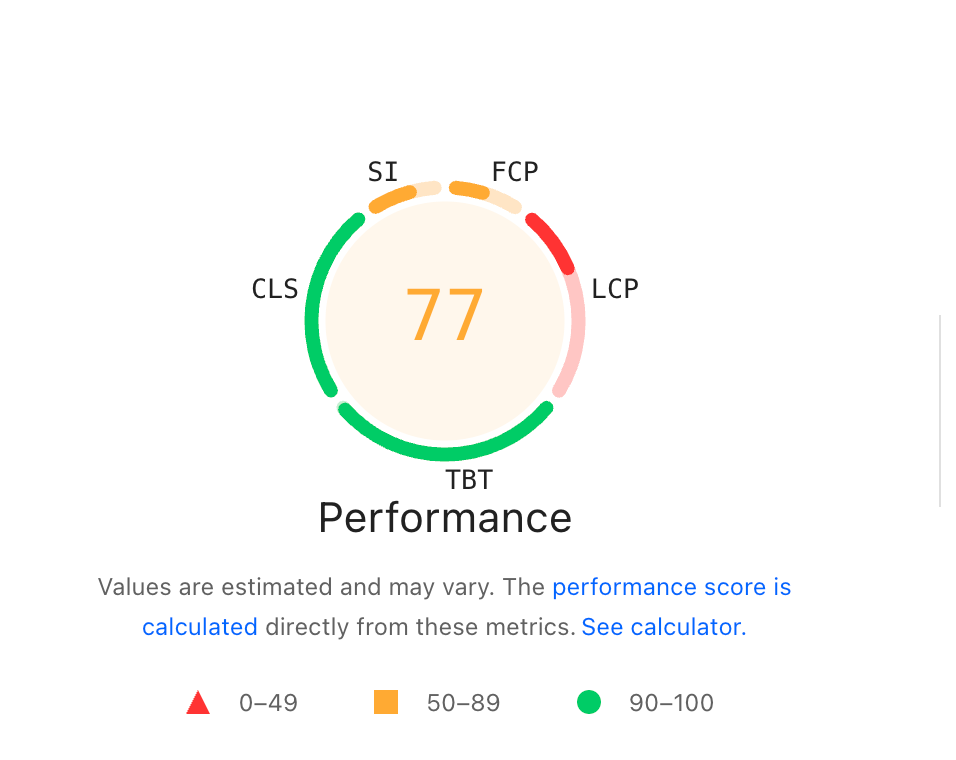
After the fixes, the performance score moved from 34 to 77.
But after the audit, one thing was clear: the store was losing customers before the product ever had a fair chance to sell itself.
But fixing speed and UX would not solve everything.
Because once the page finally loaded, I found another problem waiting for the customer:
The content was talking too much and answering too little.
The pages were talking too much and answering too little
One product page made the content problem obvious.
If I am buying a T-shirt, I want to know the size, fit, colour, fabric, stock, delivery time, return policy and final price.
I probably do not need three paragraphs explaining how the fabric came into existence.
That became my rule for the rewrite:
If the information does not help the customer understand, compare or buy, it has to earn its place.
I stripped out generic, AI-heavy copy and rebuilt product content around buying decisions.
I reviewed competing retailers and looked for information gaps we could fill better. The goal was not to make the page longer.
It was to make the next decision easier.
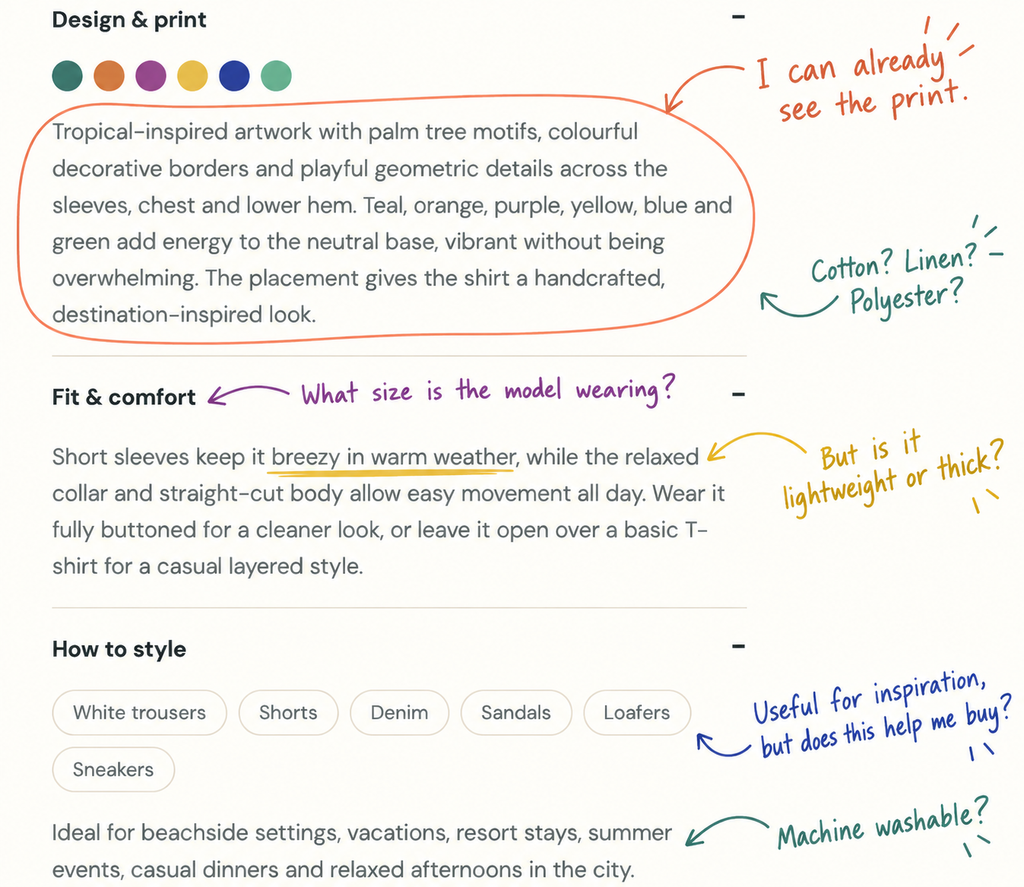
So the first thing I did was rewrite the product description around what a buyer actually wants to know, not what AI assumes they want to hear.
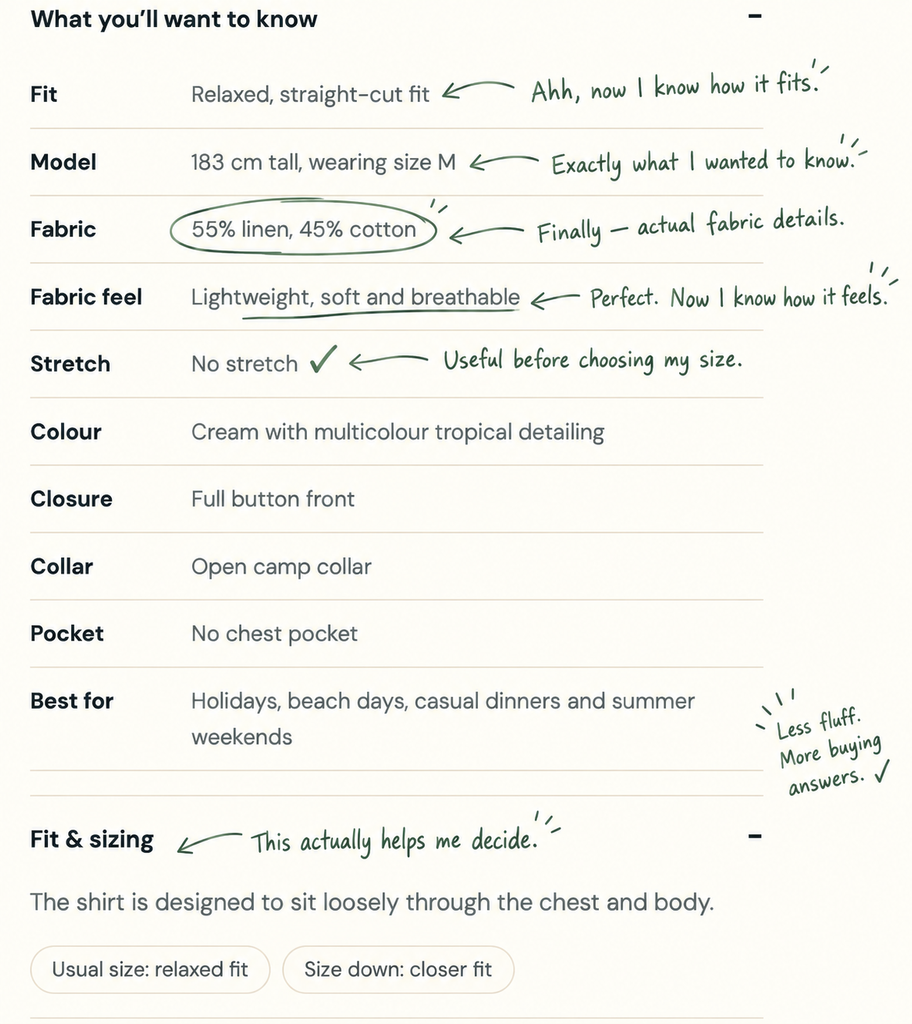
After the rewrite, the page was finally answering the questions a customer might ask before buying.
But better content could only take us so far.
If the page was still slow, awkward on mobile, or making people hunt for the next step, the customer could still leave before those answers ever mattered.
That took me to the next problem: the buying journey itself.
Then I shortened the distance between landing and buying
Content could not fix a slow or awkward page.
So I worked through the technical friction that mattered to the journey: oversized images, unnecessary scripts, mobile responsiveness, long-scroll layouts, weak CTA placement, internal linking, titles, templates and relevant structured data.
I wanted fewer steps between:
The backlink profile needed attention too.
The business had previously bought cheap links in bulk. A third-party tool showed an 15% spam score.
I reviewed the profile, stopped the bulk-link approach and cleaned what could reasonably be cleaned.
The same metric later fell to 4%.
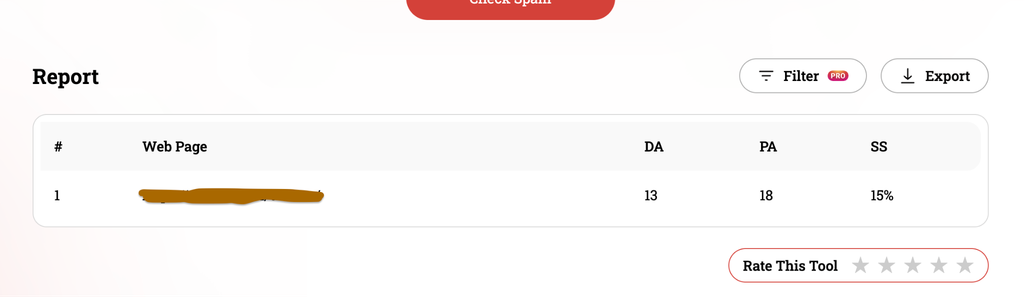
To bring that 15% down, I went link by link instead of treating backlinks as a volume game.
I removed or flagged low-quality, irrelevant domains, stopped the bulk-link activity, and kept only links that made sense for the business.
Over time, the profile became much cleaner.
The spam score dropped from 15% to 4%.
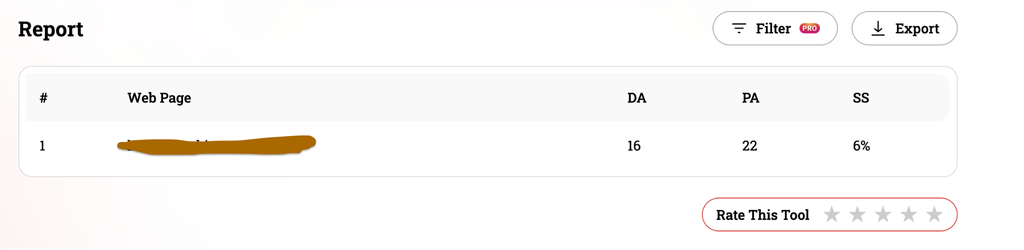
By then, the site was cleaner, faster and technically stronger.
But one question still bothered me:
What was stopping the customers who made it all the way to the cart?
The answer came from one abandoned checkout.
Then a customer told us what the dashboards could not
The most useful clue did not come from GA4.
It came from an abandoned cart.
We followed up with a shopper who had added products but never completed the order.
The reply was simple: they had found a better discount elsewhere, and the coupon we offered did not work for returning customers.
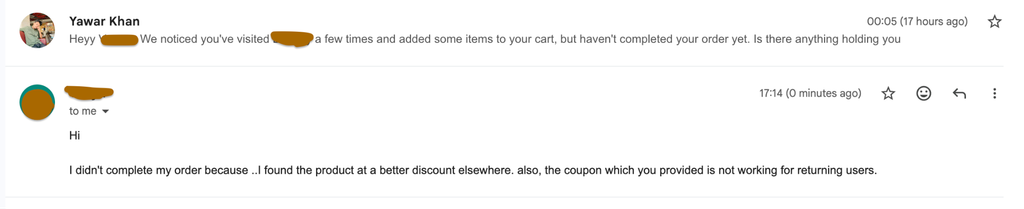
One email does not explain every abandoned cart.
But it exposed something important.
The customer had found us. They had found the product. They had shown buying intent.
The failure happened after acquisition. That changed the work again.
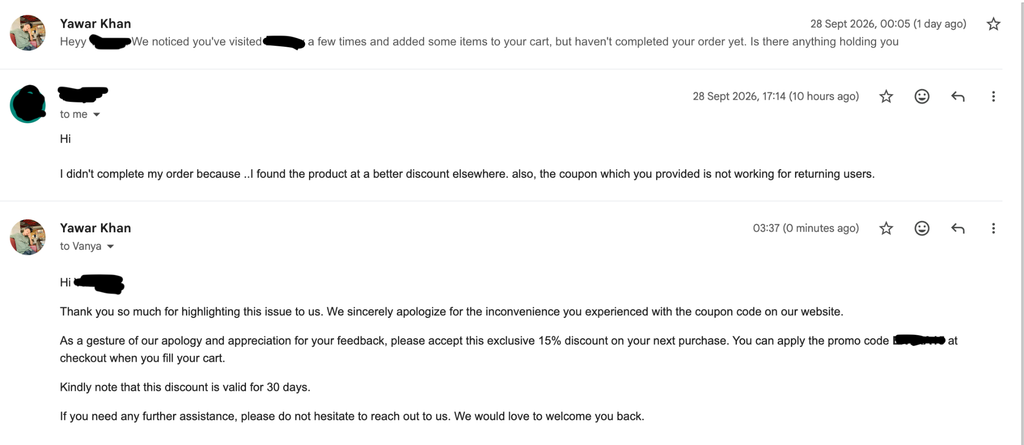
I made offer eligibility clearer, pushed relevant seasonal products, used small discounts where they made commercial sense and followed up with selected abandoned-cart customers using exclusive codes.
SEO could win the click.
It could not rescue a weak offer at checkout.
Once we fixed the obvious leaks at checkout, I did not want to just send more people into the same funnel and hope for the best.
The next job was to make organic search bring in people who were more likely to buy, not just more people.
Organic growth still mattered. I just wanted better traffic.
I created content around real shopping questions, improved internal links between informational and commercial pages, updated metadata where intent was weak, and used competitor and community research to find questions worth answering.
Search Console gave me the query. Customer behaviour gave me the context.
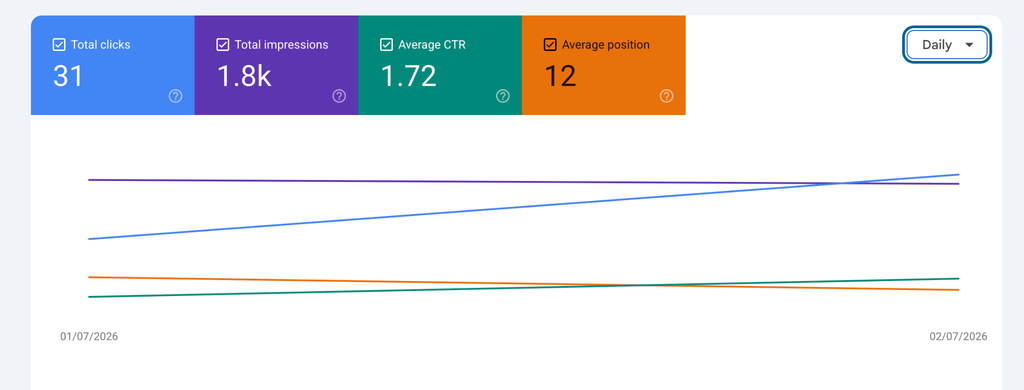
At that point, daily impressions were not even crossing the 2000 mark. One July GSC view showed just 31 clicks, 1.8k impressions, a 1.7% CTR and an average position of 12.
That gave me a very clear baseline to work from.
I stopped treating every query like a separate keyword and started mapping them into intent clusters.
I grouped related searches by what the user was actually trying to do: compare, discover, validate, or buy. Then I built small blog clusters around those journeys, linked them back to the most relevant commercial pages, and used GSC to spot queries sitting just outside page one that needed stronger topical support.
Instead of publishing more content, I focused on making each page earn visibility from a wider set of connected searches.
That is when daily impressions started moving from around 244 to 7000+.
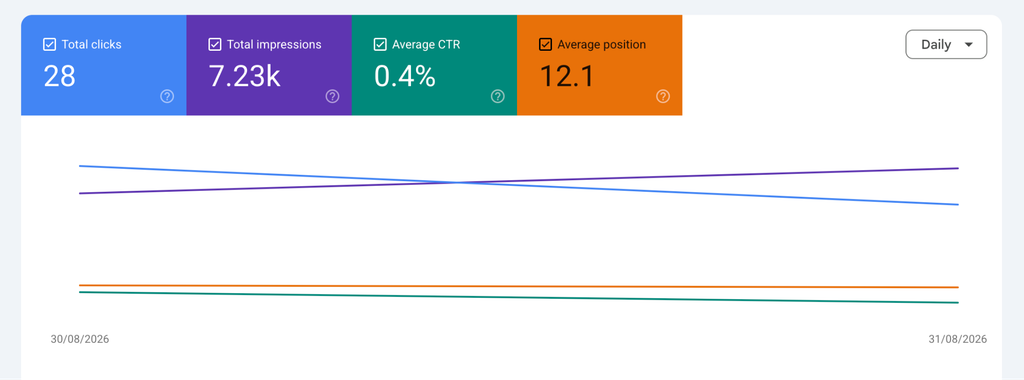
The visibility was finally moving. But impressions were never the end goal.
The real test was whether all that extra search demand would turn into actual sales in August.
August beat the target I had set
July was not a clean “before” month. I was implementing changes throughout it.
So I treat July as the implementation month and August as the first full results month.
July closed with 244 total sales.
August closed with 536.
That is a 119.7% month-over-month increase.
Confirmed sales moved from 226 to 498.
Average daily sales moved from 7.9 to 17.3.
The number of active brands stayed at 12.
Bounce rate moved from 67.82% to 27%, a reduction of 40.82 percentage points.
The CEO had wanted 800+.
I had told him 450 was the realistic ceiling I was prepared to stand behind.
We finished at 536.
What made that result more meaningful was what happened underneath it. The sales increase came while the site was holding attention far better, with bounce rate dropping from 67.82% to 25.6%.
In other words, we were not just getting more visibility. More of the people who arrived were actually staying long enough to shop.
What I would not claim
I would not write:
“SEO doubled sales.”
It would make a better headline and a worse case study.
Several things changed at once: technical SEO, product content, mobile UX, offers, seasonal promotion, abandoned-cart recovery and organic content.
I cannot isolate the 119.7% increase and hand all the credit to one channel.
What I can defend is this:
The store entered August with a very different customer journey from the one I had reviewed at the start of July. And the commercial numbers moved with it.
If you’ve made it this far, you already know how I work.
You’ve seen how I question the obvious, find what’s really holding growth back, and turn the answer into numbers.

So maybe the next case study I write shouldn’t be about this brand.
YOU’VE SEEN HOW I WORK
If you’ve made it this far, you already know how I work.
You’ve seen how I question the obvious, find what’s really holding growth back, and turn the answer into numbers.
So maybe the next case study I write shouldn’t be about this brand.
Maybe it should be about yours.
But every good growth story starts with understanding the business first.
Let’s sit down, look at where your brand is today, and talk about where we could take it next.
Maybe our next conversation becomes my next case study.